 Climaviso
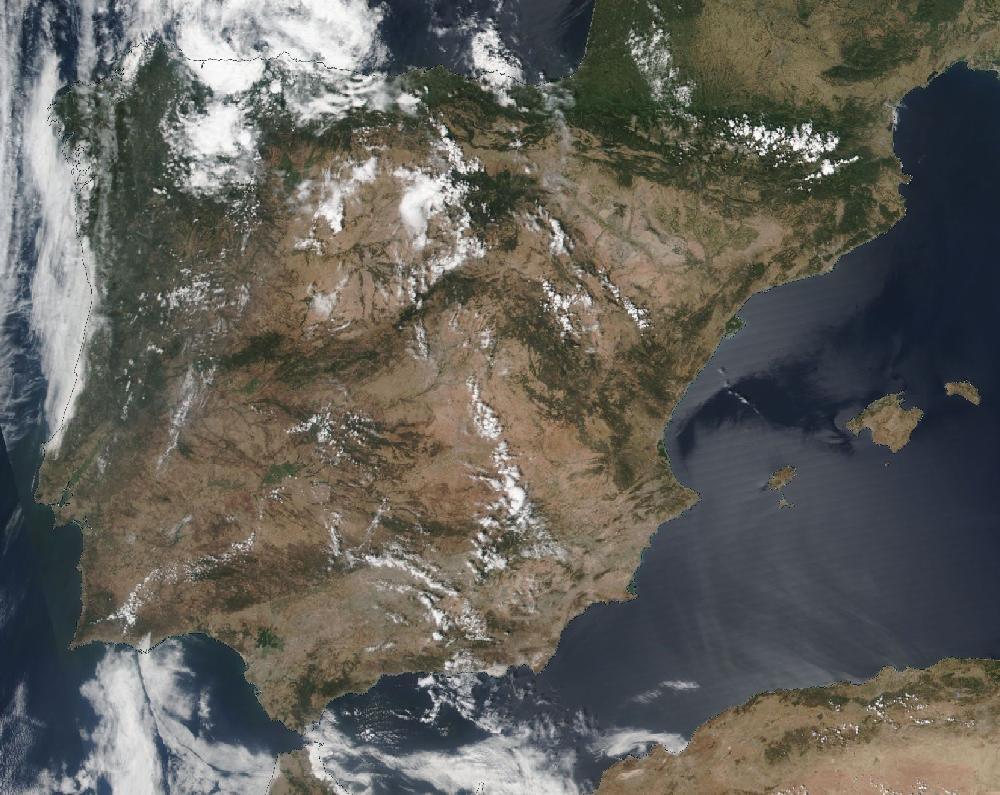
July 2019 heatwave: heat and storms across much of Spain, 20–26 July 2019
20 July 2019 to 26 July 2019. Updated 26 October 2026.
AEMET records a heatwave from 20 July to 25 July 2019.
Over 7 days, 74 of Spain's 182 warning zones had an orange or red warning for heat and storms: 148 zone-days at orange or red, 3 of them red. The day with the most zones at orange or red was 23 July, with 52 zones.
23 July was the day with the most people in zones under an orange or red warning: 9.9 million people live there (INE municipal register, 2025).
How it compares
- It is number 23 of 119 episodes since June 2018 by zone-days at orange or red.
- Among the 37 heat episodes, it is number 20.
Day by day
| Day | Red | Orange | Yellow | Orange or red warnings for |
|---|---|---|---|---|
| Sat 20 July | — | 11 | 47 | heat |
| Sun 21 July | — | 10 | 57 | heat |
| Mon 22 July | — | 30 | 77 | heat, storms |
| Tue 23 July | 3 | 49 | 58 | storms, heat, wind |
| Wed 24 July | — | 17 | 78 | heat |
| Thu 25 July | — | 11 | 67 | heat |
| Fri 26 July | — | 17 | 43 | storms |
Zones with a warning each day, at their highest level that day.
The zones
And 63 more zones with yellow warnings only.
What AEMET's stations measured
The most measured in the zones with an orange or red warning, on their warning days: 46.3 l/m² of rain in 24 h at Donostia / San Sebastián, Igeldo (Gipuzkoa litoral) on 26 July; a 105 km/h gust at Cabrales (Cordillera y Picos de Europa) on 22 July; a high of 42.4 °C at Andújar (Morena y Condado) on 21 July.
| Zone | Most rain in 24 h | Strongest gust | Highest temperature |
|---|---|---|---|
| Gipuzkoa litoral | 46.3 l/m² Donostia / San Sebastián, Igeldo · 26 July | 66 km/h Mutriku · 23 July | 40.1 °C Errenteria, Añarbe · 23 July |
| Bizkaia interior | 45.0 l/m² Abadiño, Urkiola · 25 July | 49 km/h Orozko, Ibarra · 23 July | 40.5 °C Balmaseda · 23 July |
| Meseta de Salamanca | 44.8 l/m² Pedraza de Alba · 23 July | 71 km/h Barbadillo · 22 July | 39.5 °C Vitigudino · 22 July |
| Cordillera Cantábrica de León | 38.2 l/m² Quintana del Castillo, Villameca · 23 July | 97 km/h Riaño · 22 July | 36.1 °C Villablino · 22 July |
| Bizkaia litoral | 35.6 l/m² Bilbao Aeropuerto · 25 July | 79 km/h Matxitxako · 23 July | 41.0 °C Forua · 23 July |
| Cordillera Cantábrica de Palencia | 33.8 l/m² Velilla del Río Carrión, Camporredondo de Alba · 26 July | 79 km/h Velilla del Río Carrión, Camporredondo de Alba · 22 July | 34.4 °C Cervera de Pisuerga · 22 July |
| Montes de Toledo | 33.6 l/m² San Pablo de los Montes · 23 July | 66 km/h San Pablo de los Montes · 23 July | 39.5 °C Navahermosa · 22 July |
| Ibérica riojana | 33.0 l/m² Enciso · 26 July | 99 km/h Enciso · 21 July | 35.3 °C Enciso · 23 July |
| Meseta de León | 31.4 l/m² Astorga · 23 July | 80 km/h León, Virgen del Camino · 22 July | 34.9 °C Lagunas de Somoza · 22 July |
| Pirineo oscense | 30.8 l/m² Valle de Hecho, Hecho · 26 July | 55 km/h Sopeira · 23 July | 40.9 °C Torla - Ordesa · 24 July |
| Norte de Cáceres | 27.8 l/m² Madrigal de la Vera · 22 July | 67 km/h Madrigal de la Vera · 22 July | 41.3 °C Madrigal de la Vera · 22 July |
| Gipuzkoa interior | 27.6 l/m² Elgeta · 25 July | 80 km/h Ordizia · 23 July | 39.8 °C Elgoibar · 23 July |
| Vertiente cantábrica de Navarra | 24.8 l/m² Articutza (automatica) · 26 July | 45 km/h Bera · 23 July | 39.3 °C Bera · 23 July |
| Cuenca del Nervión | 23.8 l/m² Amurrio · 25 July | 49 km/h Amurrio · 24 July | 39.0 °C Amurrio · 23 July |
| Litoral cántabro | 23.7 l/m² Santander · 26 July | 52 km/h Santander Aeropuerto · 23 July | 36.4 °C Castro Urdiales · 23 July |
| Cordillera y Picos de Europa | 23.4 l/m² Amieva, Panizales · 25 July | 105 km/h Cabrales · 22 July | 33.5 °C Aller, Felechosa · 23 July |
| Centro de Huesca | 22.4 l/m² Almudévar · 26 July | 74 km/h Almudévar · 26 July | 39.7 °C Barbastro · 23 July |
| Central y Valles Mineros | 21.2 l/m² Oviedo · 25 July | 35 km/h Oviedo · 25 July | 29.3 °C Mieres, Baiña · 23 July |
| Meseta de Valladolid | 20.6 l/m² Villalón de Campos · 22 July | 104 km/h Villalón de Campos · 22 July | 39.8 °C Sardón de Duero · 22 July |
| Cantabria del Ebro | 20.3 l/m² Reinosa · 26 July | 68 km/h Valderredible, Cubillo de Ebro · 23 July | 37.3 °C Valderredible, Polientes · 22 July |
And 54 more zones with an orange or red warning.
For each zone, the highest value its AEMET stations measured on the episode's warning days (the lowest, for the low temperature), with the station and the day. Rain from 07:00 to 07:00 UTC; gust: the day's strongest. It is what the zone's stations measured, not every town, and a measurement, like a warning, is not damage.
How AEMET's warnings unfolded
The red warning reached 3 zone-days, and AEMET always issued it ahead of time (median: 25 h). The first warning of any level for those same days had come a median 35 h earlier.
| Zone | Day | First warning | Red issued | For · notice |
|---|---|---|---|---|
| Bizkaia interior | Tue 23 | Sat 20 Jul, 23:50 orange | Mon 22 Jul, 11:18 | 12:00 · 25 h before |
| Bizkaia litoral | Tue 23 | Sat 20 Jul, 23:50 orange | Mon 22 Jul, 11:18 | 12:00 · 25 h before |
| Ribera del Ebro de Zaragoza | Tue 23 | Sat 20 Jul, 23:50 orange | 08:57 | 12:00 · 3 h before |
The full timeline: 196 changes at orange or red
Only the changes involving red are listed: there were 196 in all.
Mon 22 July
- Bizkaia interior, Bizkaia litoral: Raises the heat warning to red: Tuesday 23, 12:00–17:00. Highs of 41 °C.
Tue 23 July
- Ribera del Ebro de Zaragoza: Raises the heat warning to red: Tuesday 23, 12:00–20:00. Highs of 42 °C.
- Bizkaia interior, Bizkaia litoral: Lowers the heat warning to orange: Tuesday 23, 16:00–20:00. Highs of 39 °C.
AEMET's issue times, in mainland Spain time (Canary Islands in island time). Notice is the time from issue to the first hour the warning covered; a warning issued “for the current hour” runs from the hour it is published.
What this says and what it doesn't
A warning is an AEMET forecast, not a measurement or a damage report: it says a threshold is expected to be exceeded in a zone. A warning is not damage; a zone is not a building.
A zone-day is one warning zone with a warning on one day. Ten zones at orange on the same day make ten zone-days. A day with several warnings in one zone counts once, at its highest level.
Each zone has its own thresholds, so an orange heat warning in Asturias doesn't mean the same temperature as in Córdoba. More in how warnings work.
To cite: “Climaviso, from AEMET warnings”.
Source: official AEMET warnings, collected by Climaviso since June 2018.
← Previous episode · All episodes · Next episode → · 2019 warnings review