 Climaviso
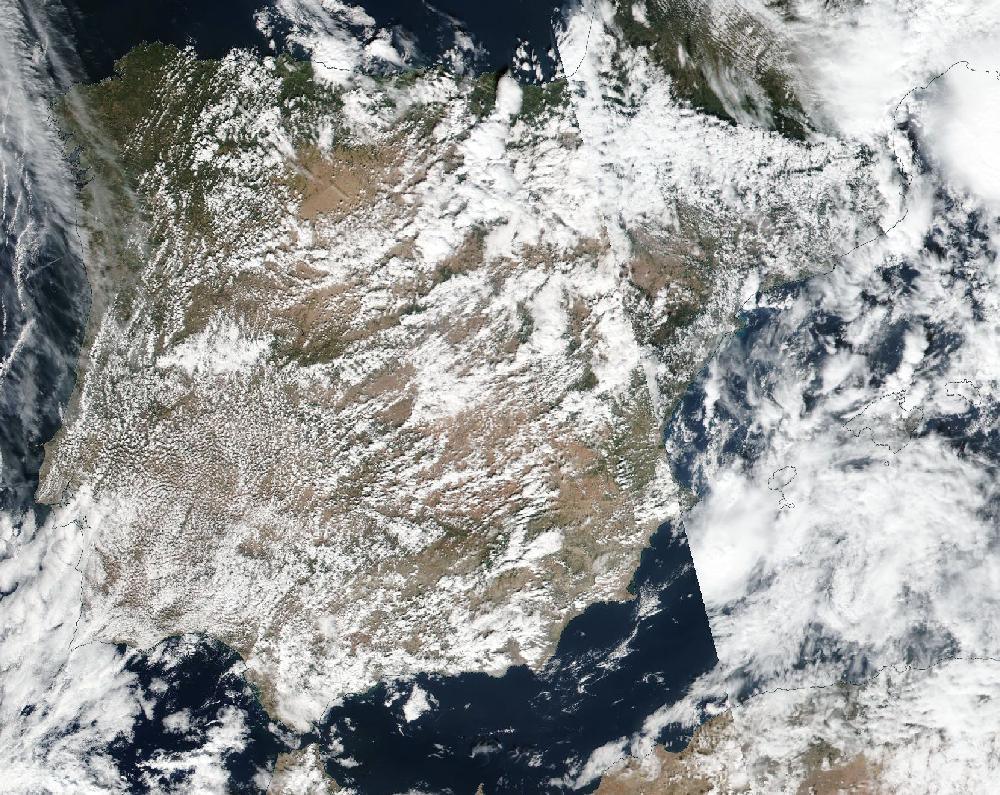
Rain and storms in Cataluña and Illes Balears, 9–10 October 2018
9 October 2018 to 10 October 2018. Updated 26 October 2026.
Over 2 days, 19 of Spain's 182 warning zones had an orange or red warning for rain and storms: 34 zone-days at orange or red, 4 of them red. The day with the most zones at orange or red was 10 October, with 19 zones.
10 October was the day with the most people in zones under an orange or red warning: 10.3 million people live there (INE municipal register, 2025).
How it compares
- It is number 91 of 119 episodes since June 2018 by zone-days at orange or red.
- Among the 35 rain episodes, it is number 24.
- Until then, no rain episode in the archive had been this widespread.
Day by day
| Day | Red | Orange | Yellow | Orange or red warnings for |
|---|---|---|---|---|
| Tue 9 October | 1 | 14 | 29 | rain, storms |
| Wed 10 October | 3 | 16 | 3 | rain, storms |
Zones with a warning each day, at their highest level that day.
The zones
| Zone | Province | Highest level | Warning days |
|---|---|---|---|
| Axarquía | Málaga | red | 2 |
| Norte y nordeste de Mallorca | Mallorca | red | 2 |
| Sol y Guadalhorce | Málaga | red | 2 |
| Ampurdán | Girona | orange | 2 |
| Depresión central de Barcelona | Barcelona | orange | 2 |
| Levante mallorquín | Mallorca | orange | 2 |
| Litoral de Barcelona | Barcelona | orange | 2 |
| Litoral norte de Tarragona | Tarragona | orange | 2 |
| Litoral sur de Girona | Girona | orange | 2 |
| Menorca | Menorca | orange | 2 |
| Pirineo de Girona | Girona | orange | 2 |
| Prelitoral de Barcelona | Barcelona | orange | 2 |
| Prelitoral de Girona | Girona | orange | 2 |
| Prelitoral norte de Tarragona | Tarragona | orange | 2 |
| Prepirineo de Barcelona | Barcelona | orange | 2 |
| Ibiza y Formentera | Ibiza y Formentera | orange | 2 |
| Interior de Mallorca | Mallorca | orange | 2 |
| Sierra Tramontana | Mallorca | orange | 2 |
| Sur de Mallorca | Mallorca | orange | 2 |
And 25 more zones with yellow warnings only.
What AEMET's stations measured
The most measured in the zones with an orange or red warning, on their warning days: 232.8 l/m² of rain in 24 h at Artà-Colònia de Sant Pere (Norte y nordeste de Mallorca) on 9 October; a 61 km/h gust at Barcelona, Fabra (Litoral de Barcelona) on 9 October.
| Zone | Most rain in 24 h | Strongest gust |
|---|---|---|
| Norte y nordeste de Mallorca | 232.8 l/m² Artà-Colònia de Sant Pere · 9 October | 54 km/h Port de Pollença · 10 October |
| Sol y Guadalhorce | 193.0 l/m² Coín · 9 October | 51 km/h Estepona · 10 October |
| Litoral norte de Tarragona | 144.9 l/m² Reus Aeropuerto · 9 October | 48 km/h Reus Aeropuerto · 9 October |
| Levante mallorquín | 98.4 l/m² Son Servera · 9 October | 43 km/h Son Servera · 9 October |
| Prelitoral de Girona | 70.3 l/m² Les Planes D'Hostoles · 9 October | 39 km/h Girona Aeropuerto · 9 October |
| Prelitoral de Barcelona | 63.6 l/m² Fogars de Montclús · 9 October | 44 km/h Pontons · 9 October |
| Pirineo de Girona | 60.1 l/m² Campdevanol · 9 October | 32 km/h Planoles · 9 October |
| Depresión central de Barcelona | 57.0 l/m² Sant Julià de Vilatorta · 9 October | 44 km/h Moià · 9 October |
| Litoral sur de Girona | 53.4 l/m² Castell D'Aro · 10 October | 40 km/h Castell D'Aro · 9 October |
| Ampurdán | 47.6 l/m² Figueres · 9 October | 41 km/h Espolla · 10 October |
| Menorca | 46.4 l/m² Ciutadella · 9 October | 47 km/h Es Mercadal · 9 October |
| Litoral de Barcelona | 43.8 l/m² Barcelona, Drassanes · 9 October | 61 km/h Barcelona, Fabra · 9 October |
| Prelitoral norte de Tarragona | 42.8 l/m² Valls · 9 October | 39 km/h Llorac · 9 October |
| Prepirineo de Barcelona * | 37.0 l/m² Berga · 9 October | 32 km/h Berga · 9 October |
| Sierra Tramontana | 29.9 l/m² Escorca, Lluc · 10 October | 57 km/h Sierra de Alfabia, Bunyola · 10 October |
| Interior de Mallorca | 28.4 l/m² Santa María del Camí · 10 October | 39 km/h Binissalem · 9 October |
| Axarquía | 25.2 l/m² Rincón de la Victoria · 9 October | 34 km/h Algarrobo · 9 October |
| Sur de Mallorca | 25.2 l/m² Llucmajor, Radar · 9 October | 50 km/h Calvià, Es Capdellà · 9 October |
| Ibiza y Formentera | 5.9 l/m² Formentera · 9 October | 39 km/h Eivissa · 9 October |
* Zone with no AEMET station: the value is from the nearest one, outside the zone.
For each zone, the highest value its AEMET stations measured on the episode's warning days (the lowest, for the low temperature), with the station and the day. Rain from 07:00 to 07:00 UTC; gust: the day's strongest. It is what the zone's stations measured, not every town, and a measurement, like a warning, is not damage.
How AEMET's warnings unfolded
The red warning reached 4 zone-days. AEMET issued it ahead of time in 1 of them (median: 119 min) and for the current hour in the other 3: warnings are also raised as things unfold. The first warning of any level for those same days had come a median 18 h earlier.
| Zone | Day | First warning | Red issued | For · notice |
|---|---|---|---|---|
| Norte y nordeste de Mallorca | Tue 9 | Mon 8 Oct, 11:32 yellow | 22:01 | 22:00 · for the current hour |
| Norte y nordeste de Mallorca | Wed 10 | Mon 8 Oct, 11:36 yellow | Tue 9 Oct, 22:01 | 00:00 · 119 min before |
| Axarquía | Wed 10 | Tue 9 Oct, 22:33 orange | 00:00 | 00:00 · for the current hour |
| Sol y Guadalhorce | Wed 10 | Tue 9 Oct, 22:33 orange | 00:00 | 00:00 · for the current hour |
The full timeline: 94 changes at orange or red
Mon 8 October
- Ampurdán, Litoral de Barcelona, Litoral sur de Girona, Pirineo de Girona, Prelitoral de Barcelona, Prelitoral de Girona: Raises the rain warning to orange: Tuesday 9, 18:00–24:00. Up to 40 mm in 1 h.
- Ampurdán, Litoral de Barcelona, Litoral sur de Girona, Pirineo de Girona, Prelitoral de Barcelona, Prelitoral de Girona: Raises the rain warning to orange: Wednesday 10, 00:00–06:00. Up to 40 mm in 1 h.
Tue 9 October
- Litoral de Barcelona: Brings the orange rain warning forward: now from 10:00 on Tuesday 9. Up to 50 mm in 1 h.
- Sol y Guadalhorce: Raises the rain warning to orange: Tuesday 9, 10:00–24:00. Up to 30 mm in 1 h.
- Ampurdán, Litoral de Barcelona, Litoral sur de Girona, Prelitoral de Barcelona: Lowers the rain warning to yellow: Tuesday 9, 12:00–24:00. Up to 20 mm in 1 h · 60 mm in 12 h.
- Ampurdán, Litoral de Barcelona, Litoral sur de Girona, Prelitoral de Barcelona: Lowers the rain warning to yellow: Wednesday 10, all day. Up to 20 mm in 1 h · 60 mm in 12 h.
- Depresión central de Barcelona: Raises the rain warning to orange: Tuesday 9, 18:00–24:00. Up to 40 mm in 1 h.
- Depresión central de Barcelona: Raises the rain warning to orange: Wednesday 10, 00:00–06:00. Up to 40 mm in 1 h.
- Ampurdán, Litoral de Barcelona, Litoral sur de Girona: Raises the storms warning to orange: Tuesday 9, 18:00–24:00.
- Ampurdán, Litoral de Barcelona, Litoral sur de Girona: Raises the storms warning to orange: Wednesday 10, 00:00–06:00.
- Levante mallorquín, Norte y nordeste de Mallorca: Raises the rain warning to orange: Tuesday 9, 19:00–21:00. Up to 50 mm in 1 h.
- Levante mallorquín, Norte y nordeste de Mallorca: Extends the orange rain warning: now until 22:00 on Tuesday 9. Up to 100 mm in 12 h.
- Levante mallorquín: Raises the rain warning to orange: Tuesday 9, 23:00–24:00. Up to 60 mm in 1 h.
- Levante mallorquín: Raises the rain warning to orange: Wednesday 10, 00:00–02:00. Up to 60 mm in 1 h.
- Norte y nordeste de Mallorca: Raises the rain warning to red: Tuesday 9, 23:00–24:00. Up to 220 mm in 12 h.
- Norte y nordeste de Mallorca: Raises the rain warning to red: Wednesday 10, 00:00–02:00. Up to 220 mm in 12 h.
- Axarquía: Raises the rain warning to orange: Tuesday 9, 23:00–24:00. Up to 45 mm in 1 h.
- Axarquía, Sol y Guadalhorce: Issues a orange rain warning: Wednesday 10, 00:00–09:00. Up to 45 mm in 1 h.
- Ampurdán, Litoral de Barcelona, Litoral norte de Tarragona, Litoral sur de Girona, Prelitoral de Barcelona, Prelitoral norte de Tarragona, Prepirineo de Barcelona: Raises the rain warning to orange: Tuesday 9, 23:00–24:00. Up to 60 mm in 1 h.
- Ampurdán, Litoral de Barcelona, Litoral sur de Girona, Prelitoral de Barcelona: Raises the rain warning to orange: Wednesday 10, 00:00–18:00. Up to 60 mm in 1 h · 150 mm in 12 h.
- Depresión central de Barcelona: Extends the orange rain warning: now until 18:00 on Wednesday 10. Up to 40 mm in 1 h · 100 mm in 12 h.
- Depresión central de Barcelona, Litoral norte de Tarragona, Pirineo de Girona, Prelitoral de Barcelona, Prelitoral de Girona, Prelitoral norte de Tarragona, Prepirineo de Barcelona: Raises the storms warning to orange: Tuesday 9, 23:00–24:00.
- Depresión central de Barcelona, Litoral norte de Tarragona, Pirineo de Girona, Prelitoral de Barcelona, Prelitoral de Girona, Prelitoral norte de Tarragona, Prepirineo de Barcelona: Raises the storms warning to orange: Wednesday 10, 00:00–06:00.
- Litoral norte de Tarragona, Prelitoral norte de Tarragona: Raises the rain warning to orange: Wednesday 10, 00:00–06:00. Up to 60 mm in 1 h.
- Pirineo de Girona, Prelitoral de Girona: Extends the orange rain warning: now until 18:00 on Wednesday 10. Up to 60 mm in 1 h · 150 mm in 12 h.
- Prepirineo de Barcelona: Raises the rain warning to orange: Wednesday 10, 00:00–18:00. Up to 60 mm in 1 h · 100 mm in 12 h.
- Menorca: Raises the rain warning to orange: Wednesday 10, 00:00–04:00. Up to 40 mm in 1 h.
- Menorca: Raises the storms warning to orange: Wednesday 10, 00:00–04:00.
Wed 10 October
- Axarquía, Sol y Guadalhorce: Raises the rain warning to red: Wednesday 10, 00:00–09:00. Up to 150 mm in 12 h.
- Levante mallorquín: Lowers the rain warning to yellow: Wednesday 10, 01:00–12:00. Up to 20 mm in 1 h.
- Norte y nordeste de Mallorca: Lowers the rain warning to yellow: Wednesday 10, 01:00–12:00. Up to 20 mm in 1 h.
- Ibiza y Formentera: Raises the rain warning to orange: Wednesday 10, 09:00–18:00. Up to 40 mm in 1 h.
- Ampurdán, Litoral sur de Girona, Prelitoral de Girona: Extends the orange rain warning: now until 21:00 on Wednesday 10. Up to 150 mm in 12 h.
- Axarquía, Sol y Guadalhorce: Raises the rain warning to orange: Wednesday 10, 09:00–12:00. Up to 40 mm in 1 h.
- Litoral norte de Tarragona: Raises the rain warning to orange: Wednesday 10, 17:00–18:00. Up to 60 mm in 1 h.
- Interior de Mallorca, Levante mallorquín, Menorca, Norte y nordeste de Mallorca, Sierra Tramontana, Sur de Mallorca: Issues a orange rain warning: Wednesday 10, 18:00–21:00. Up to 40 mm in 1 h.
- Ampurdán, Litoral sur de Girona: Extends the orange rain warning: now until 24:00 on Wednesday 10. Up to 40 mm in 1 h.
- Litoral de Barcelona: Raises the rain warning to orange: Wednesday 10, 21:00–24:00. Up to 40 mm in 1 h.
AEMET's issue times, in mainland Spain time (Canary Islands in island time). Notice is the time from issue to the first hour the warning covered; a warning issued “for the current hour” runs from the hour it is published.
What this says and what it doesn't
A warning is an AEMET forecast, not a measurement or a damage report: it says a threshold is expected to be exceeded in a zone. A warning is not damage; a zone is not a building.
A zone-day is one warning zone with a warning on one day. Ten zones at orange on the same day make ten zone-days. A day with several warnings in one zone counts once, at its highest level.
Each zone has its own thresholds, so an orange heat warning in Asturias doesn't mean the same temperature as in Córdoba. More in how warnings work.
To cite: “Climaviso, from AEMET warnings”.
Source: official AEMET warnings, collected by Climaviso since June 2018.